TacEvaA Performance Evaluation Framework
for Vision-Based Tactile Sensors
We propose a comprehensive framework for evaluating vision-based tactile sensors, systematically comparing design properties and sensing performance across four representative sensors.
A common language
for tactile sensing.
Standardized metrics.
Repeatable experiments.
Informed sensor selection.
Abstract
Vision-based tactile sensors (VBTSs) are widely used in robotic tasks, because of the high spatial resolution they offer and their relatively low manufacturing costs. However, variations in their sensing mechanisms, structural dimension, and other parameters lead to significant performance disparities between VBTSs currently in use. This makes it challenging to optimize VBTSs for specific tasks, as both the initial choice and subsequent fine-tuning are hindered by the lack of standardized metrics.
To address this issue, we present TacEva, a comprehensive evaluation framework for the quantitative analysis of VBTS performance. We define a set of performance metrics that capture and quantify the key characteristics displayed in typical application scenarios. For each metric, we designed an experimental pipeline that provides a structured procedure for performance quantification. We then applied this evaluation approach to multiple VBTSs with distinct sensing mechanisms.
The results show that the proposed framework yields a thorough evaluation of each design, and provides quantitative indicators for each performance dimension. This enables researchers to pre-select the most appropriate VBTS on a task by task basis, and also offers performance-guided insights for the optimization of VBTS design.
How do VBTS see touch?
This interactive demo illustrates how different VBTS sensing mechanisms respond to a ball pressing a soft surface: IMM (intensity + lighting), MDM (marker displacement), and IMM+MDM (combined).
Drag the indenter in any side-view panel, or focus a panel and use the arrow keys.
IMM
Side View
Camera View
Side view: ball presses gel, producing contact shadow + photometric intensity changes.
MDM
Side View
Camera View
Side view markers spread laterally and compress vertically as deformation grows.
IMM + MDM
Side View
Camera View
Hybrid side view overlays IMM lighting behavior with MDM marker displacement.
MDM + MFM
Side View
Camera View
Transparent-surface effect: background remains visible while marker displacement is tracked.
One framework. Multiple perspectives.
Explore the definitions, experimental protocols, and results behind each performance metric.
Standard performance
Establish the sensing baselineCalibration Process
.jpg)
Definition. Two sequential steps with the sensor on a robot: (1) Surface geometry via first-contact mapping with a 10 mm spherical indenter; (2) Force/position mapping from synchronized images and 6‑axis F/T labels across randomized normal + shear stimuli.
Protocol. Probe the surface on a grid (≈0.1 mm steps) until contact (threshold ≈0.02 N), then indent to safe depths per device while adding small x–y displacements. Train a common ResNet‑18 baseline (70/20/10 split) to regress $(P_x, P_y, P_z, F_x, F_y, F_z)$. Report MAE, $R^2$, and sMAPE: $$\text{sMAPE} = \frac{1}{n} \sum_{i=1}^{n} \frac{|y_i - \hat{y}_i|}{\frac{|y_i| + |\hat{y}_i|}{2} + \epsilon} \times 100\%$$
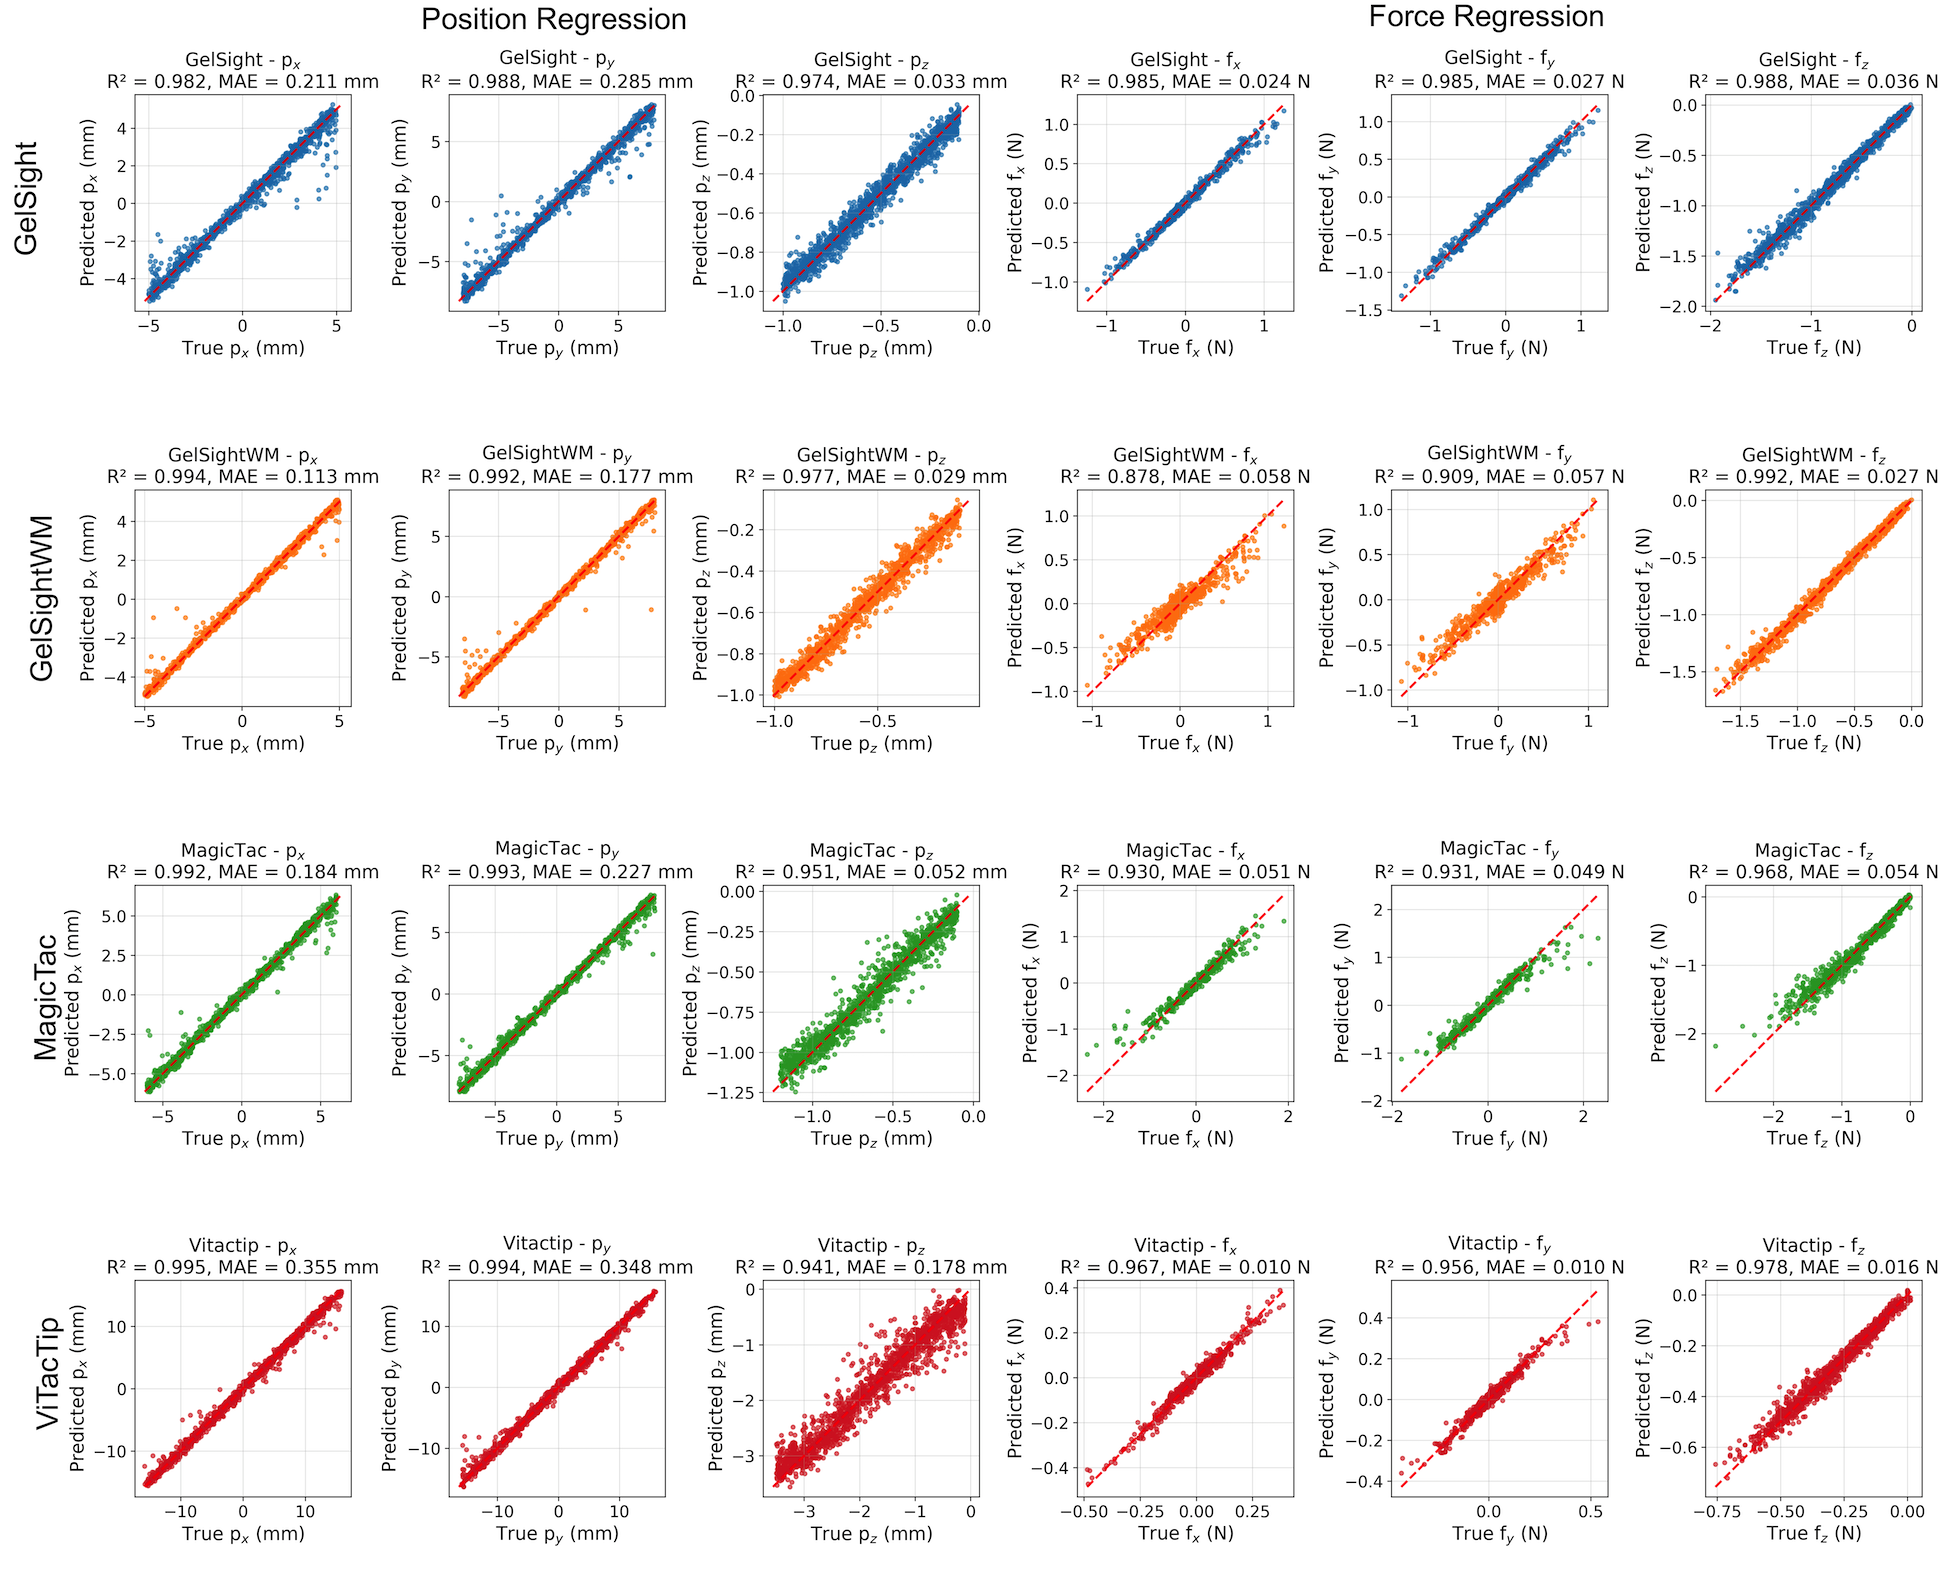
Analysis. ViTacTip minimizes absolute force errors; GelSight variants excel in Pz; marker‑free GelSightWM is strong in Fz/Pz but weaker in Fxy; MagicTac is competitive in Pxy yet noisier in Fz.
Spatial Resolution
.jpg)
Definition. Ability to distinguish closely spaced features. We report accuracy as a function of tolerance $\epsilon$ using a grating‑classification task:
Protocol. 3D‑printed dot/line gratings (≈0.05–2.0 mm). 100 presses per sample with randomized yaw. Train classifier; sweep ε.
Analysis. Above ≈5 mm, all near‑perfect. At 0.05 mm, GelSight/GelSightWM ≈99%, MagicTac ≈98%, ViTacTip ≈80% — reflecting gel stiffness/geometry and effective pixel density.
Evaluation using dot and line grating samples, with spacing from 0 mm (flat) to 2 mm, to determine the minimum resolvable feature size. All four sensors were benchmarked using grating-based samples for spatial resolution assessment.
Spatial Resolution Test Samples
Dot and Line samples from 0.0625 mm to 2 mm spacing - examples shown below
Sensitivity
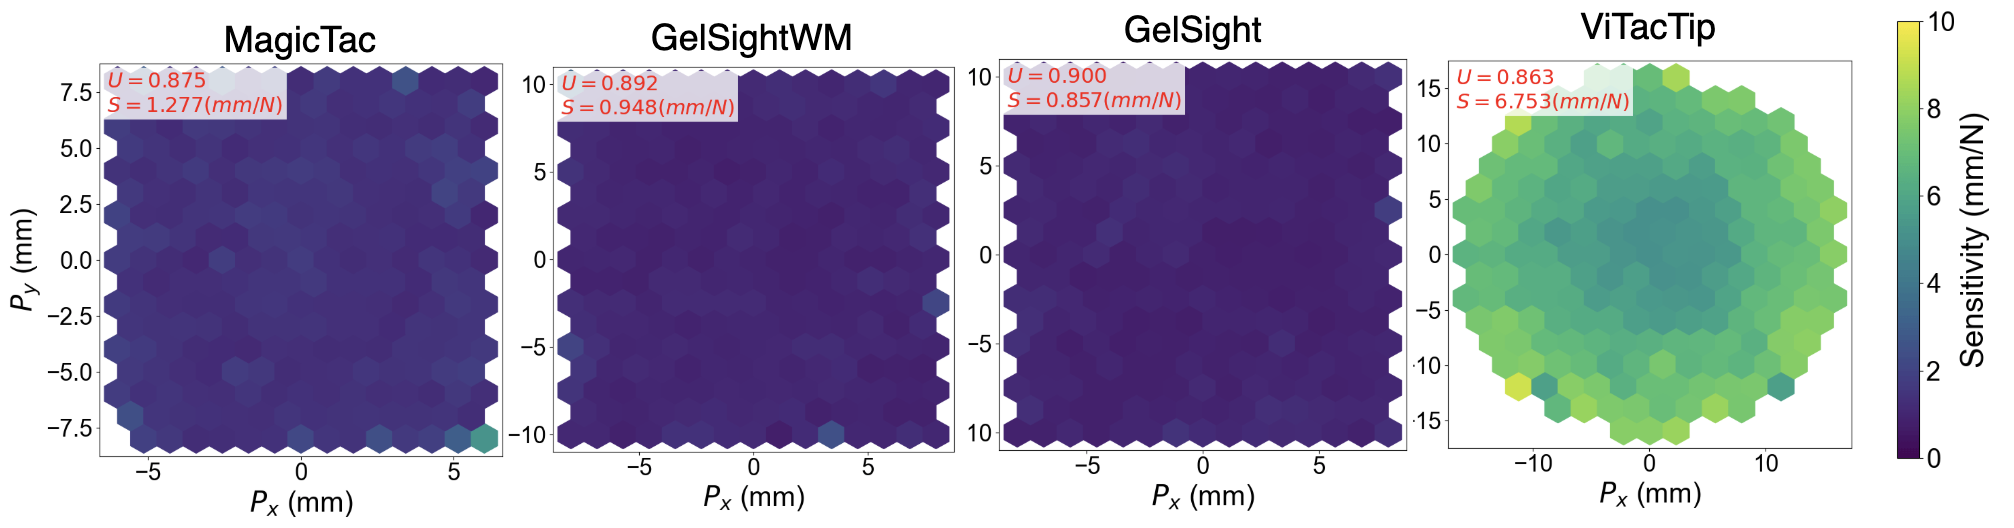
Definition. Normal compliance: $S = \Delta z / F$ (mm/N). Uniformity (0–1): $U = 1 / (1 + \sigma/|\mu|)$ from binned sensitivity means.
Protocol. Reuse calibration data; bin by (x,y); compute mean S per bin to form maps; aggregate μ, σ for U.
Analysis. ViTacTip is most sensitive but less uniform (edge‑enhanced S); GelSight/MagicTac are stiffer with higher U.
Robustness
Understand real-world reliabilitySpatial Robustness
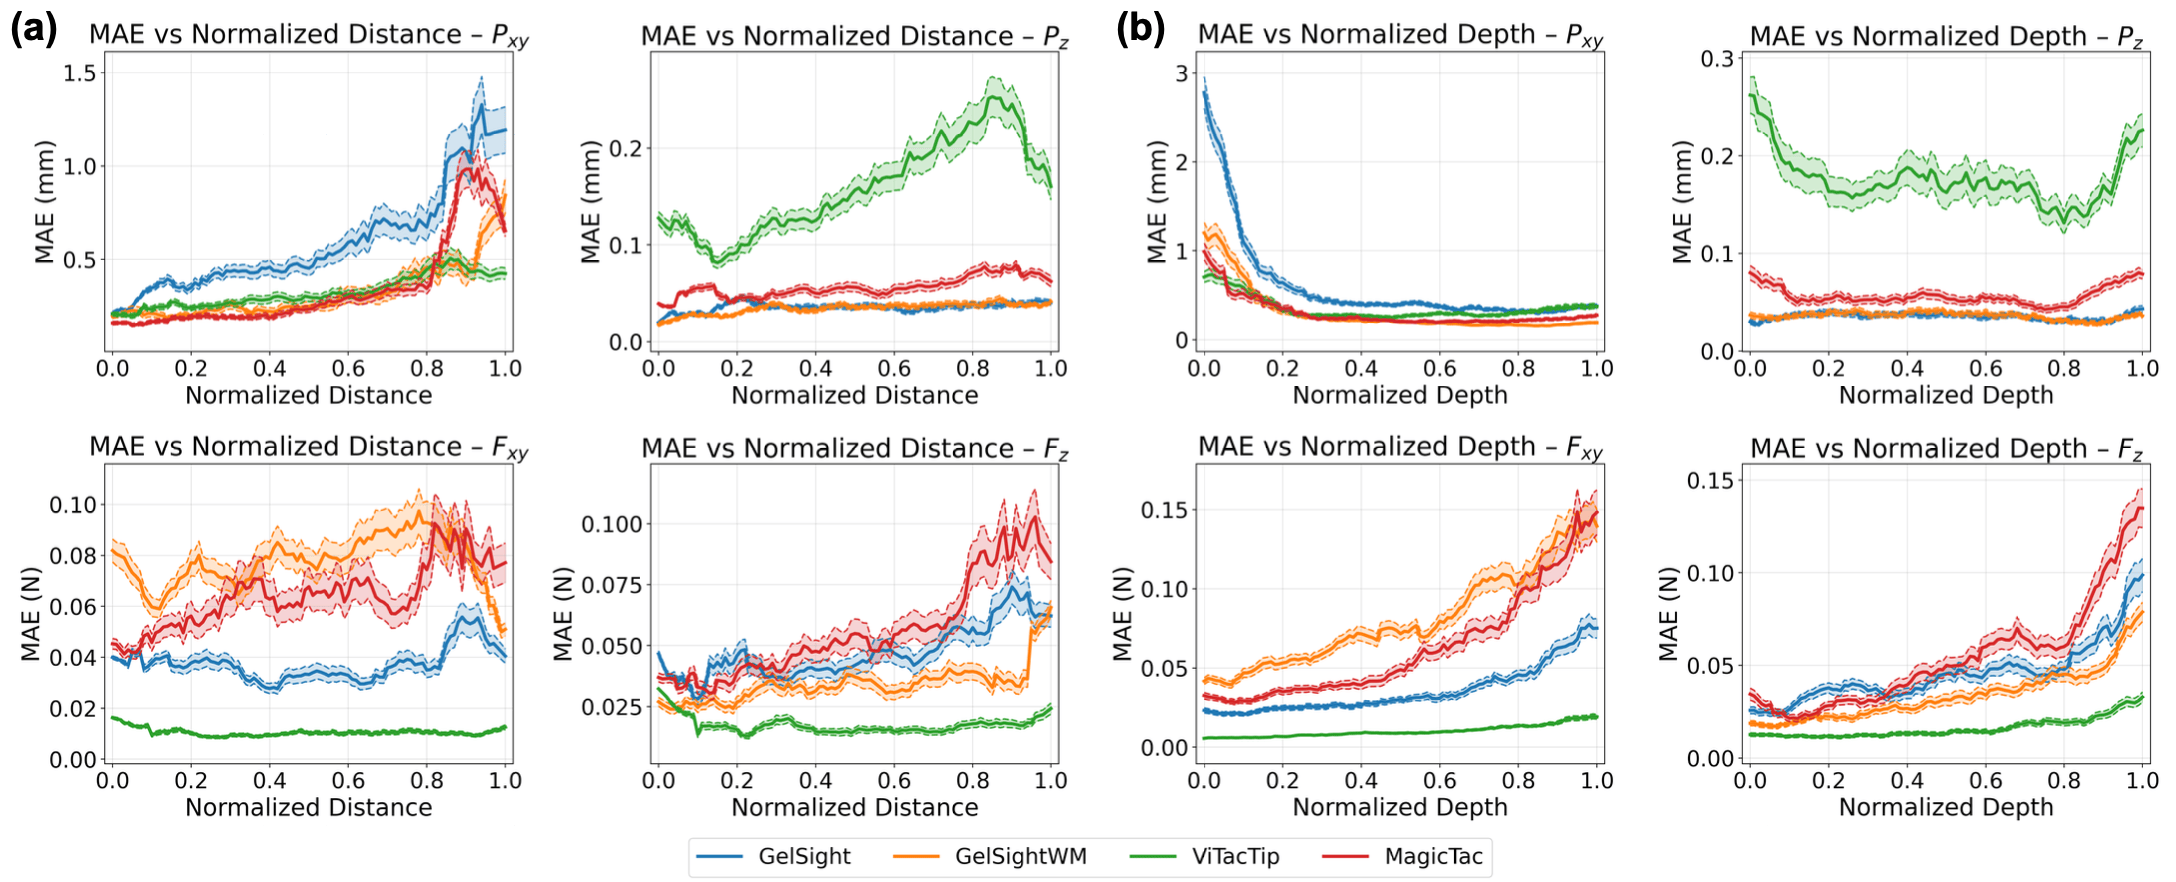
Definition. Stability of error across location and depth. Compute MAE per radial bin and per depth bin; robustness (lower is better):
Protocol. Collect a held‑out grid (≈1.6k points) with the same probing pattern; evaluate by bins over normalized radius/depth.
Analysis. ViTacTip holds force errors flat across the surface; planar gels show edge growth (notably in Fz and Pxy). Depth improves Pxy after shallow contact.
Lighting Robustness
.jpg)
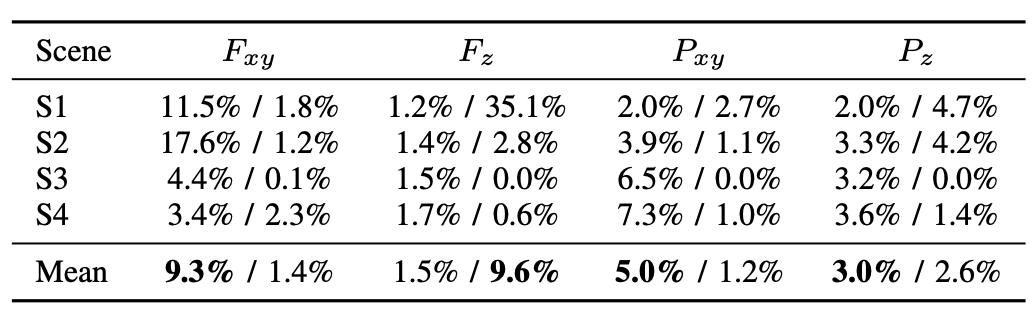
Definition. Sensitivity of prediction error to illumination changes (transparent/semi‑transparent devices). Example metric:
Protocol. Test under four scenes (diffuse/point/mixed; varying intensity). Compare to training‑light baseline using mean grayscale intensity.
Analysis. ViTacTip's errors grow under bright point sources; MagicTac's intensities shift less but error variance can rise due to grid interactions with external light.
Repeatability
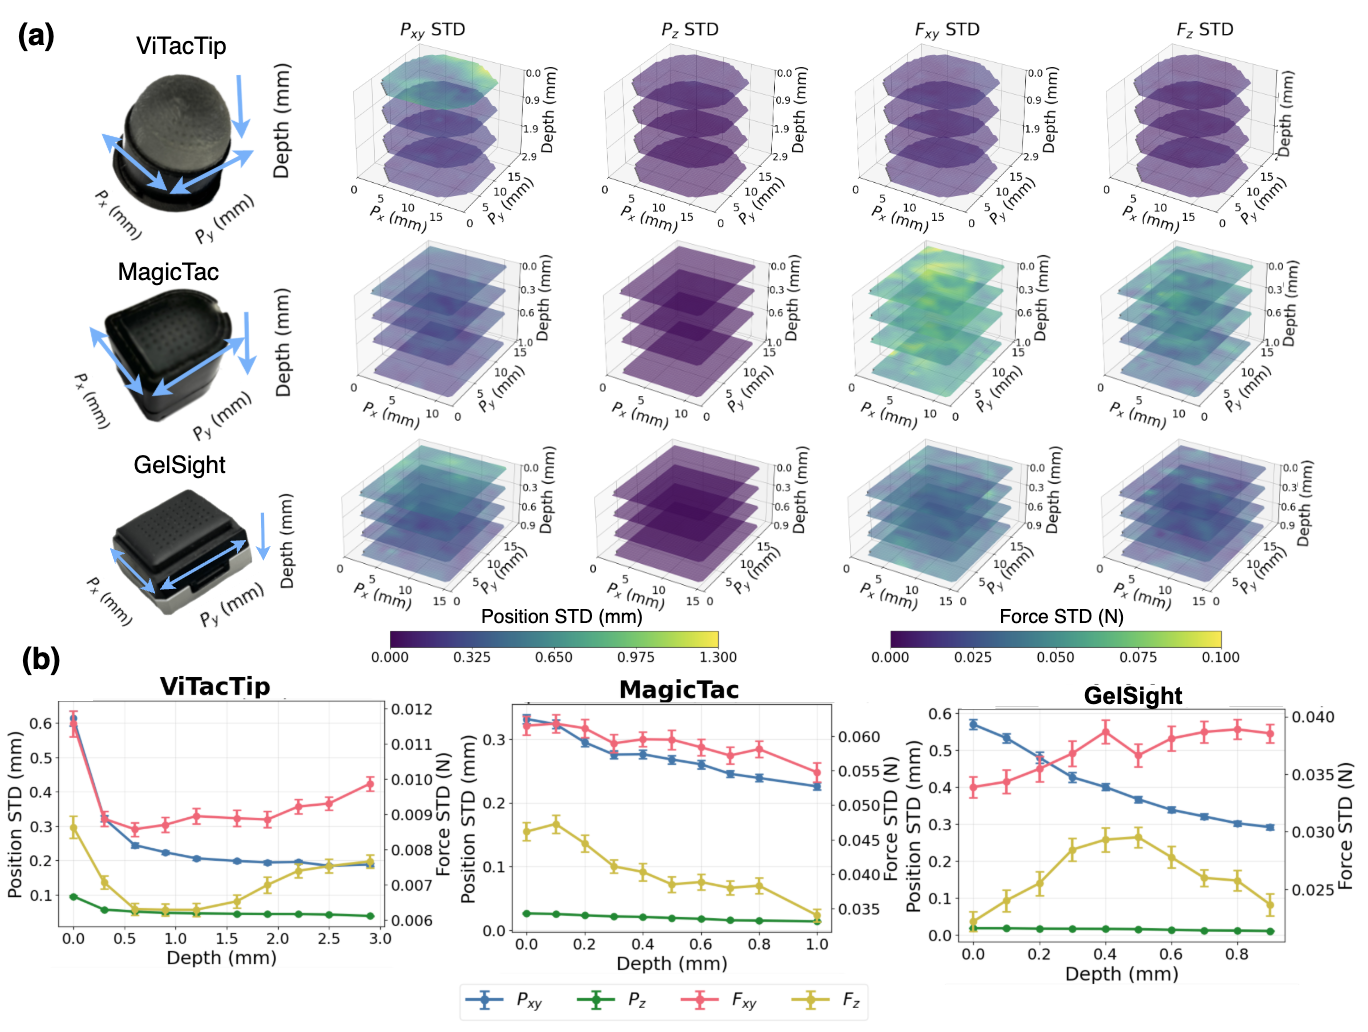
Definition. Across $N$ repeats at $K$ points and $D$ depths, per‑channel variability (lower is better):
Protocol. K≈100 random points, step 0.1 mm to max depth; N=10 repeats per (point,depth).
Analysis. ViTacTip is most repeatable for forces and competitive for positions; GelSight is strongest in Pz; MagicTac is intermediate for position and higher variance for force.
Additional analysis
Look beyond a single measurementInter‑sensor Variability
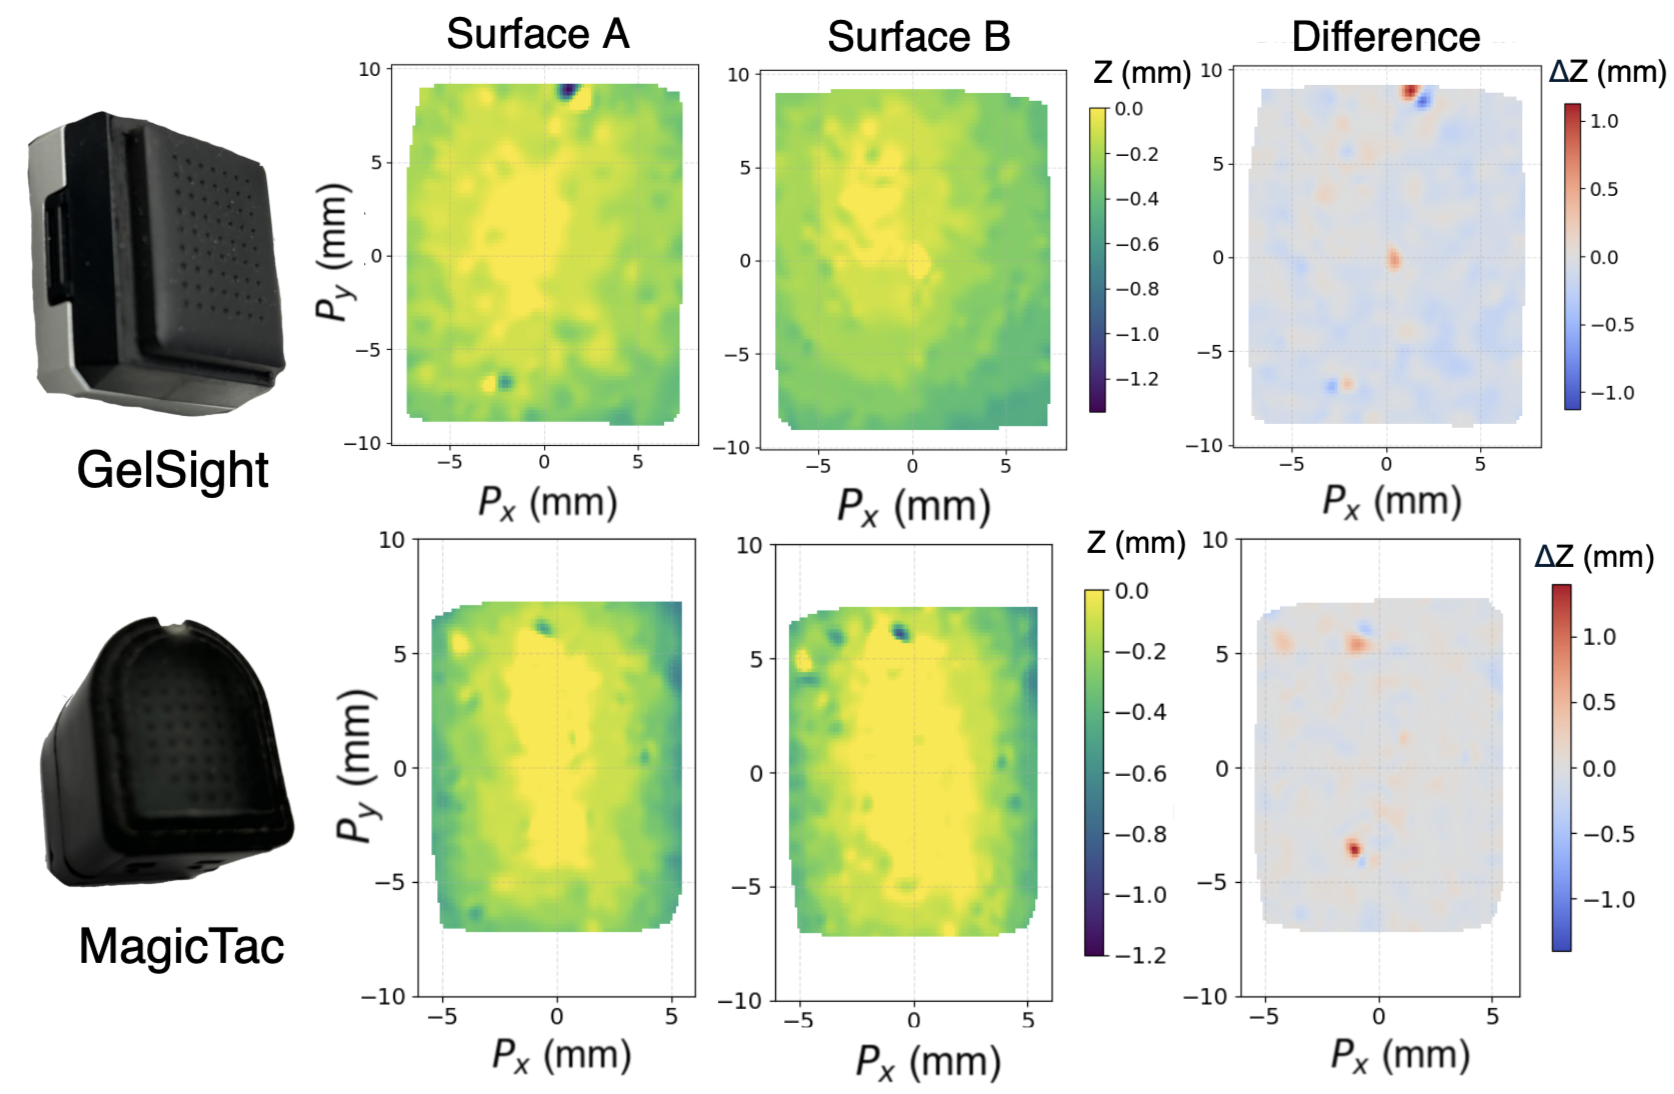
Compare reconstructed surfaces across units of the same type via rigid alignment and nearest‑neighbor distances inside the common hull; the mean absolute surface gap summarizes manufacturing consistency.
Hysteresis
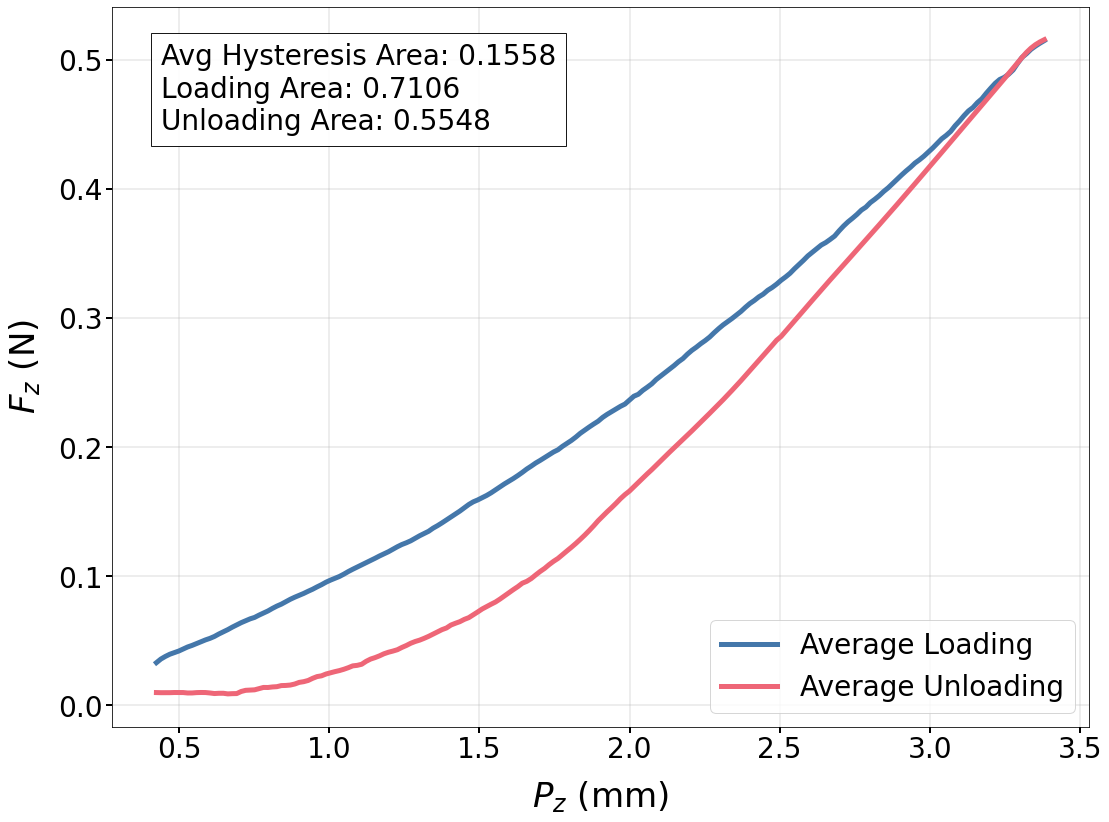
Quantify the area between load/unload F–Δz curves (trapezoidal rule) over the overlap range at multiple surface points; ViTacTip shows measurable, spatially varying hysteresis, while GelSight variants/MagicTac show no clear hysteresis under our protocol.
Different sensors. Different strengths.
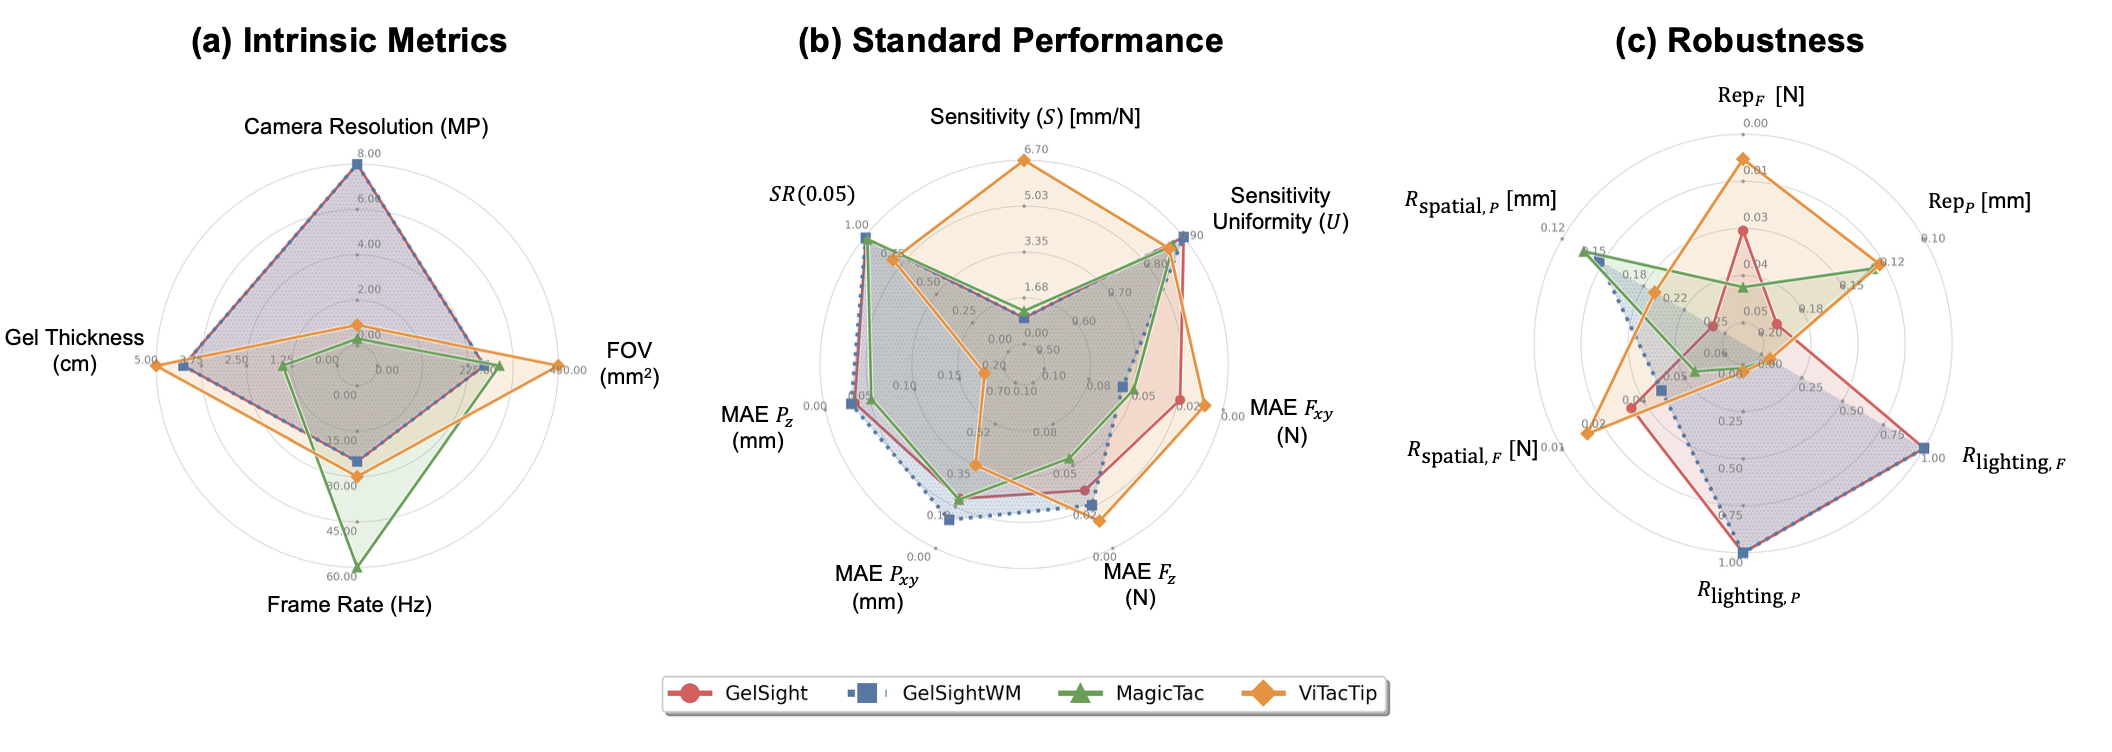
Selection guide: ViTacTip — best for low‑force, deep/soft contacts and force repeatability; sensitive to lighting and weaker in ultra‑fine resolution. MagicTac — fast, strong planar localization; force estimates noisier; control lighting when possible. GelSight — highest camera resolution and stable depth (Pz); modest frame rate and edge effects. GelSightWM — practical choice when shear is secondary; robust Pz/Fz without markers.
Build on this work
If TacEva is useful for your research, please consider citing our paper. Download .bib ↗
@article{Cong2026TacEva,
  title   = {{TacEva}: A Performance Evaluation Framework for Vision-Based Tactile Sensors},
  author  = {Cong, Qingzheng and Oh, Steven and Fan, Wen and Luo, Shan and Althoefer, Kaspar and Zhang, Dandan},
  journal = {Advanced Intelligent Systems},
  year    = {2026},
  volume  = {8},
  number  = {4},
  pages   = {e202501179},
  doi     = {10.1002/aisy.202501179},
  url     = {https://doi.org/10.1002/aisy.202501179}
}